More than a feeling

I've been thinking a lot lately about times when math teachers force students to do things without technology, or "by-hand" and then later (or perhaps never) show them later how they can do the procedure faster or more efficiently with technology.

To illustrate my first point, I have to tell you what happened with me. And, as will be no surprise to anyone, this example centers around AP Stats.

When I teach confidence intervals and hypothesis tests, I follow the same route that most AP Stat teachers follow. First students find the interval and the p-value by-hand. I don't show them that their calculator has a button for each of these functions that will do all the work for them. I do this, I tell myself, because it will help them remember everything that the calculator is doing in the background when they press these buttons.

But here's my dilemma. About six weeks later, I challenge them to do the procedure, by-hand. I give them limited information so that they have to reconstruct the p-value in a different way then they have for most of the unit--eliminating the possibility that they can use the faster method. And guess what? They don't remember. Not a clue. So I spent two weeks restricting their use so that they remember/understand certain concepts (because I am convinced that the faster way eliminates the understanding of those concepts) but when it comes time to show me that those two weeks of by-hand work actually paid off? Goose egg!

Now before I provide my suggested solution, let me talk about another situation: finding the standard deviation.

Here I differ from most of my colleagues. Most teachers will tell you something like this:

"Well, I know we can find standard deviation on our calculators, but I make them figure out 1 or 2 by hand, that way they have a feel for what's really going on."

I think this is so much baloney. Here's my issue. When it comes to writing a test with my colleagues, they never offer me an assessment question that they believe will really measure if the students really "got the feeling". In fact, when the test is said and done, I didn't have my colleagues who taught this way saying "See! Here is the question that my kids got right and your kids didn't. That's because my kids calculated the standard deviation by-hand!" I have yet to see a problem where students seem to benefit from 20 minutes of 1930's by-hand work. If anything, it just makes them hate your class a little bit.

[tangent: Many of you teach multiple periods of stats. Run an experiment. Have 1 period just use their calculator. Have the other spend 20 minutes calculating standard deviation by hand. Then look at your tests and see if there's a difference!]

In the end, both of these scenarios boil down to writing high quality assessment items. In the case of the standard deviation, I have never observed that calculating it by hand helps students successfully describe the standard deviation as the typical distance of the data from the mean. But if you're going to really assess your students' understanding and not just their button-pushing skills, you'd better write an open-ended question that assesses precisely this concept. (AP Stats, 2007 #1 is a nice starting point.) When your goal is for students to be able to meaningful interpret this value, I'm betting you'll change how you spend your class time. And by-hand calculation probably won't be taking up that time.

With p-values, I definitely need to up my game on my assessments. I need to write assessment items that test my students abilities to find a p-values without being able to press a test button on their calculator. This is a skill I value. There is TOO much magic happening with the technology. But instead of unrealistically forcing a by-hand calculation by hiding calculator functionality, I need to write creative test questions that require these kinds of skills. These questions aren't actually hard to write, I just haven't done so (simple example: provide students with a test statistic and they hypotheses and ask for the conclusion). Part of what I'm learning (ever so slowly, it seems) is that when students are failing to produce the kind of understanding I'm hoping for, I need to figure out both formative and summative ways to asses that concept more frequently. Because if I'm not forcing them to answer questions about a concept, they letting it slide out of their mind and replacing the space with SnapChats!

One final, and much more general observation. The best math teachers are always working towards understanding. They will argue with their colleagues about activities and manipulatives that help develop understanding in our students, but that take some extra time. But sometimes (not always) the assessments do not actually measure the understanding that we spent two extra days working towards. So I finish with this challenge: The next time you say to yourself

"I'm spending an extra day on this topic so that students really understand it!"

make sure you have an assessment item ready to see if that time paid off. 
Back to School Night

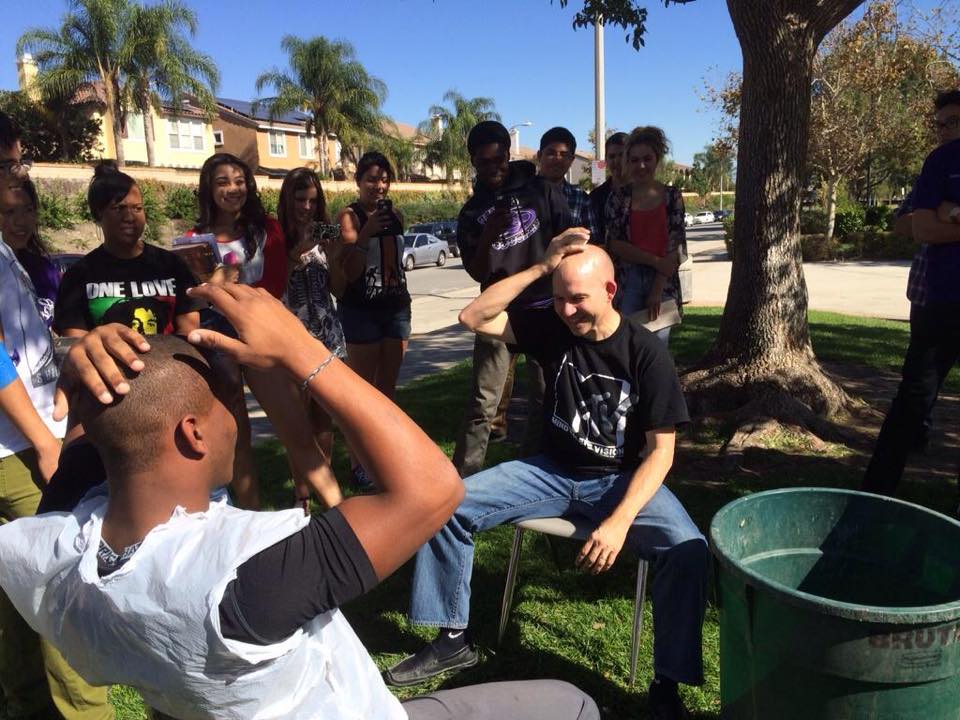
I went to Back to School Night for my sophomore tonight. It is always fascinating to sit on the other side of the teacher's podium. My son has some great teachers this year. And a lot of them did a nice job telling us what to expect from the year ahead.

My favorite bit was a teacher who talked about 2 requirements. He suggested two things that kids can't forgive you for if you're missing them.

*Be enthusiastic for your subject.

*Be enthusiastic about enjoying your students.

That's the truth. If you have those 2 things, not much else matters. That's basically my goal at Back to School Night, although I saw no one who approached the night quite like I do (perhaps more on that in another post.)

There is a bit of crazy on this night. For one, there's lots of talk about point collection. Many teachers talk about difficult tests, but then reassuringly add that there are ways to offset low test scores. Apparently none of the parents are concerned that their child will demonstrate incompetence on tests as long as there are other ways to fix this loss of points. But this is not the place for an SBG lesson.

The oddest thing about a Back to School evening (especially as an Honors parent) is all the serious warnings. 

"This class is rigorous!"

"Deadlines are important!"

"The pace is really fast and we have a lot of material to cover!"

These all important warnings are inserted randomly through the evening. Sometimes in a serious tone. Sometimes apologetically. Other times defensively. And while I'm tempted to feel that the teachers need to calm down a notch (or two), I noticed that it is the parents who are feeding this beast.

Indeed, the parents seem to want this. Many take copious notes. (Although the mom dressed to the nines and surfing her phone during the entire chemistry chat was nothing but hilarious. How much you want to bet her student is LESS addicted to his/her phone than she is?) The parents are attentive to every detail. They take down information like "Reading quiz every Friday!" and "Tutoring after school Mondays and Wednesdays!". They've got a 15 year-old honors student who apparently they don't trust to remember these words. Even though they're in the syllabus, on the board, and have already been played out for 4 weeks, parents are concerned that their child needs to receive this information. Again.

In short, parents like this game. It is familiar--their school memories are probably about rigor and pace. And they want a competitive college for their child. So they don't actually want to hear that this is too easy.

Hopefully this post might encourage a few to step back and look at some of the peculiar practices that are part of American education. Every culture has them. And I'm very thankful for the hard-working people who teach my kids.

Intimidation, Inspiration, & Implementation

Attending the AP Statistics Reading is an exhilarating experience. A professional development experience like no other. The friendships I have made (and continue to enjoy) at this event are increasingly precious to me.

As I left the 2015 Reading I had contradictory emotions.

I felt intimidated. 

You have all these great conversations at the Reading. Ideas, rubrics, teaching frustrations, and statistical ideas are bandied about in a never-ending torrent. And as each new idea is tossed across a lunch table or over a late night snack, someone always has an answer. A clever idea. An instructional practice. And often ideas that I've failed to work into my classroom.

There are amazing teachers at the Reading. And they work hard, teach well, and inspire their students to learn how think statistically at a very high level.

Fortunately, as I processed the ideas of the week, I was able to transform my intimidation into inspiration. I realized that it's easy to hear people share their best ideas and forget that they also have areas of struggle and frustration. More importantly (because honestly, some of these people are simply rock stars in the classroom!) I can implement some of these ideas in my own teaching. 

Here are a few of the ideas that I hope to implement this year:

  • FRAPPY's are awesome. They help students dive into the rubrics. I need to get organized and use them more often.
  • Finding ways to incorporate multiple choice practice into my classroom is essential. 
  • "Making it Stick" is a book I should read. It has some awesome ideas for making learning last longer and be more durable.

That is a fairly short list. But I generally try to only implement a couple of new things each year. I've already read "Making it Stick" and it has proved to provide ideas galore. In fact, I'm hoping to do a follow-up post focused solely on ideas from this book very soon.

Many thanks to my fellow Readers for the inspiration!

Unreplaceable Eggs

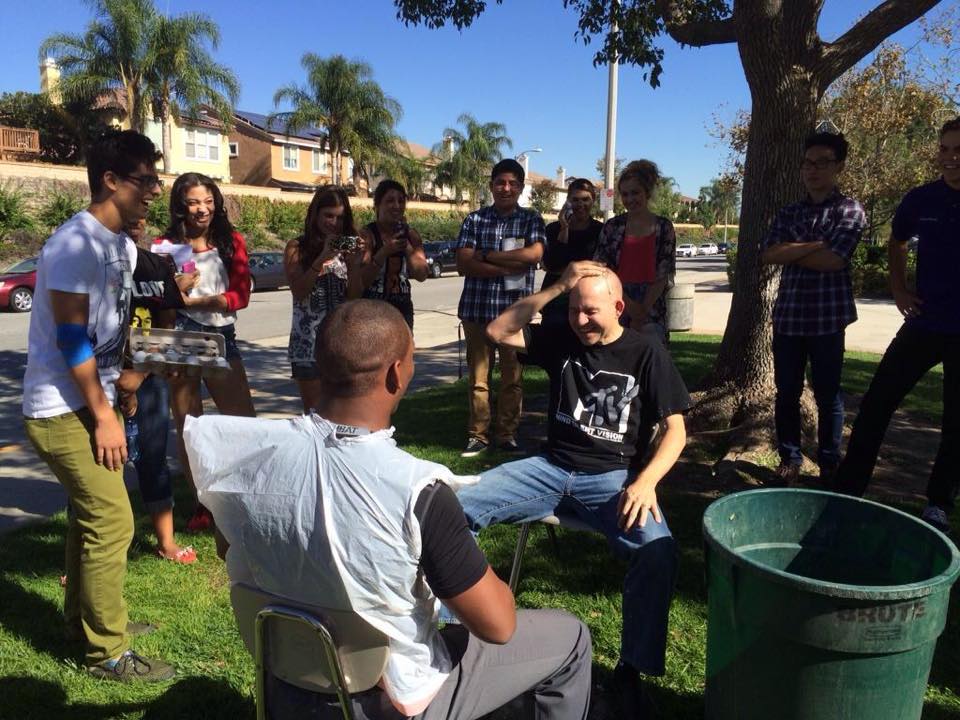
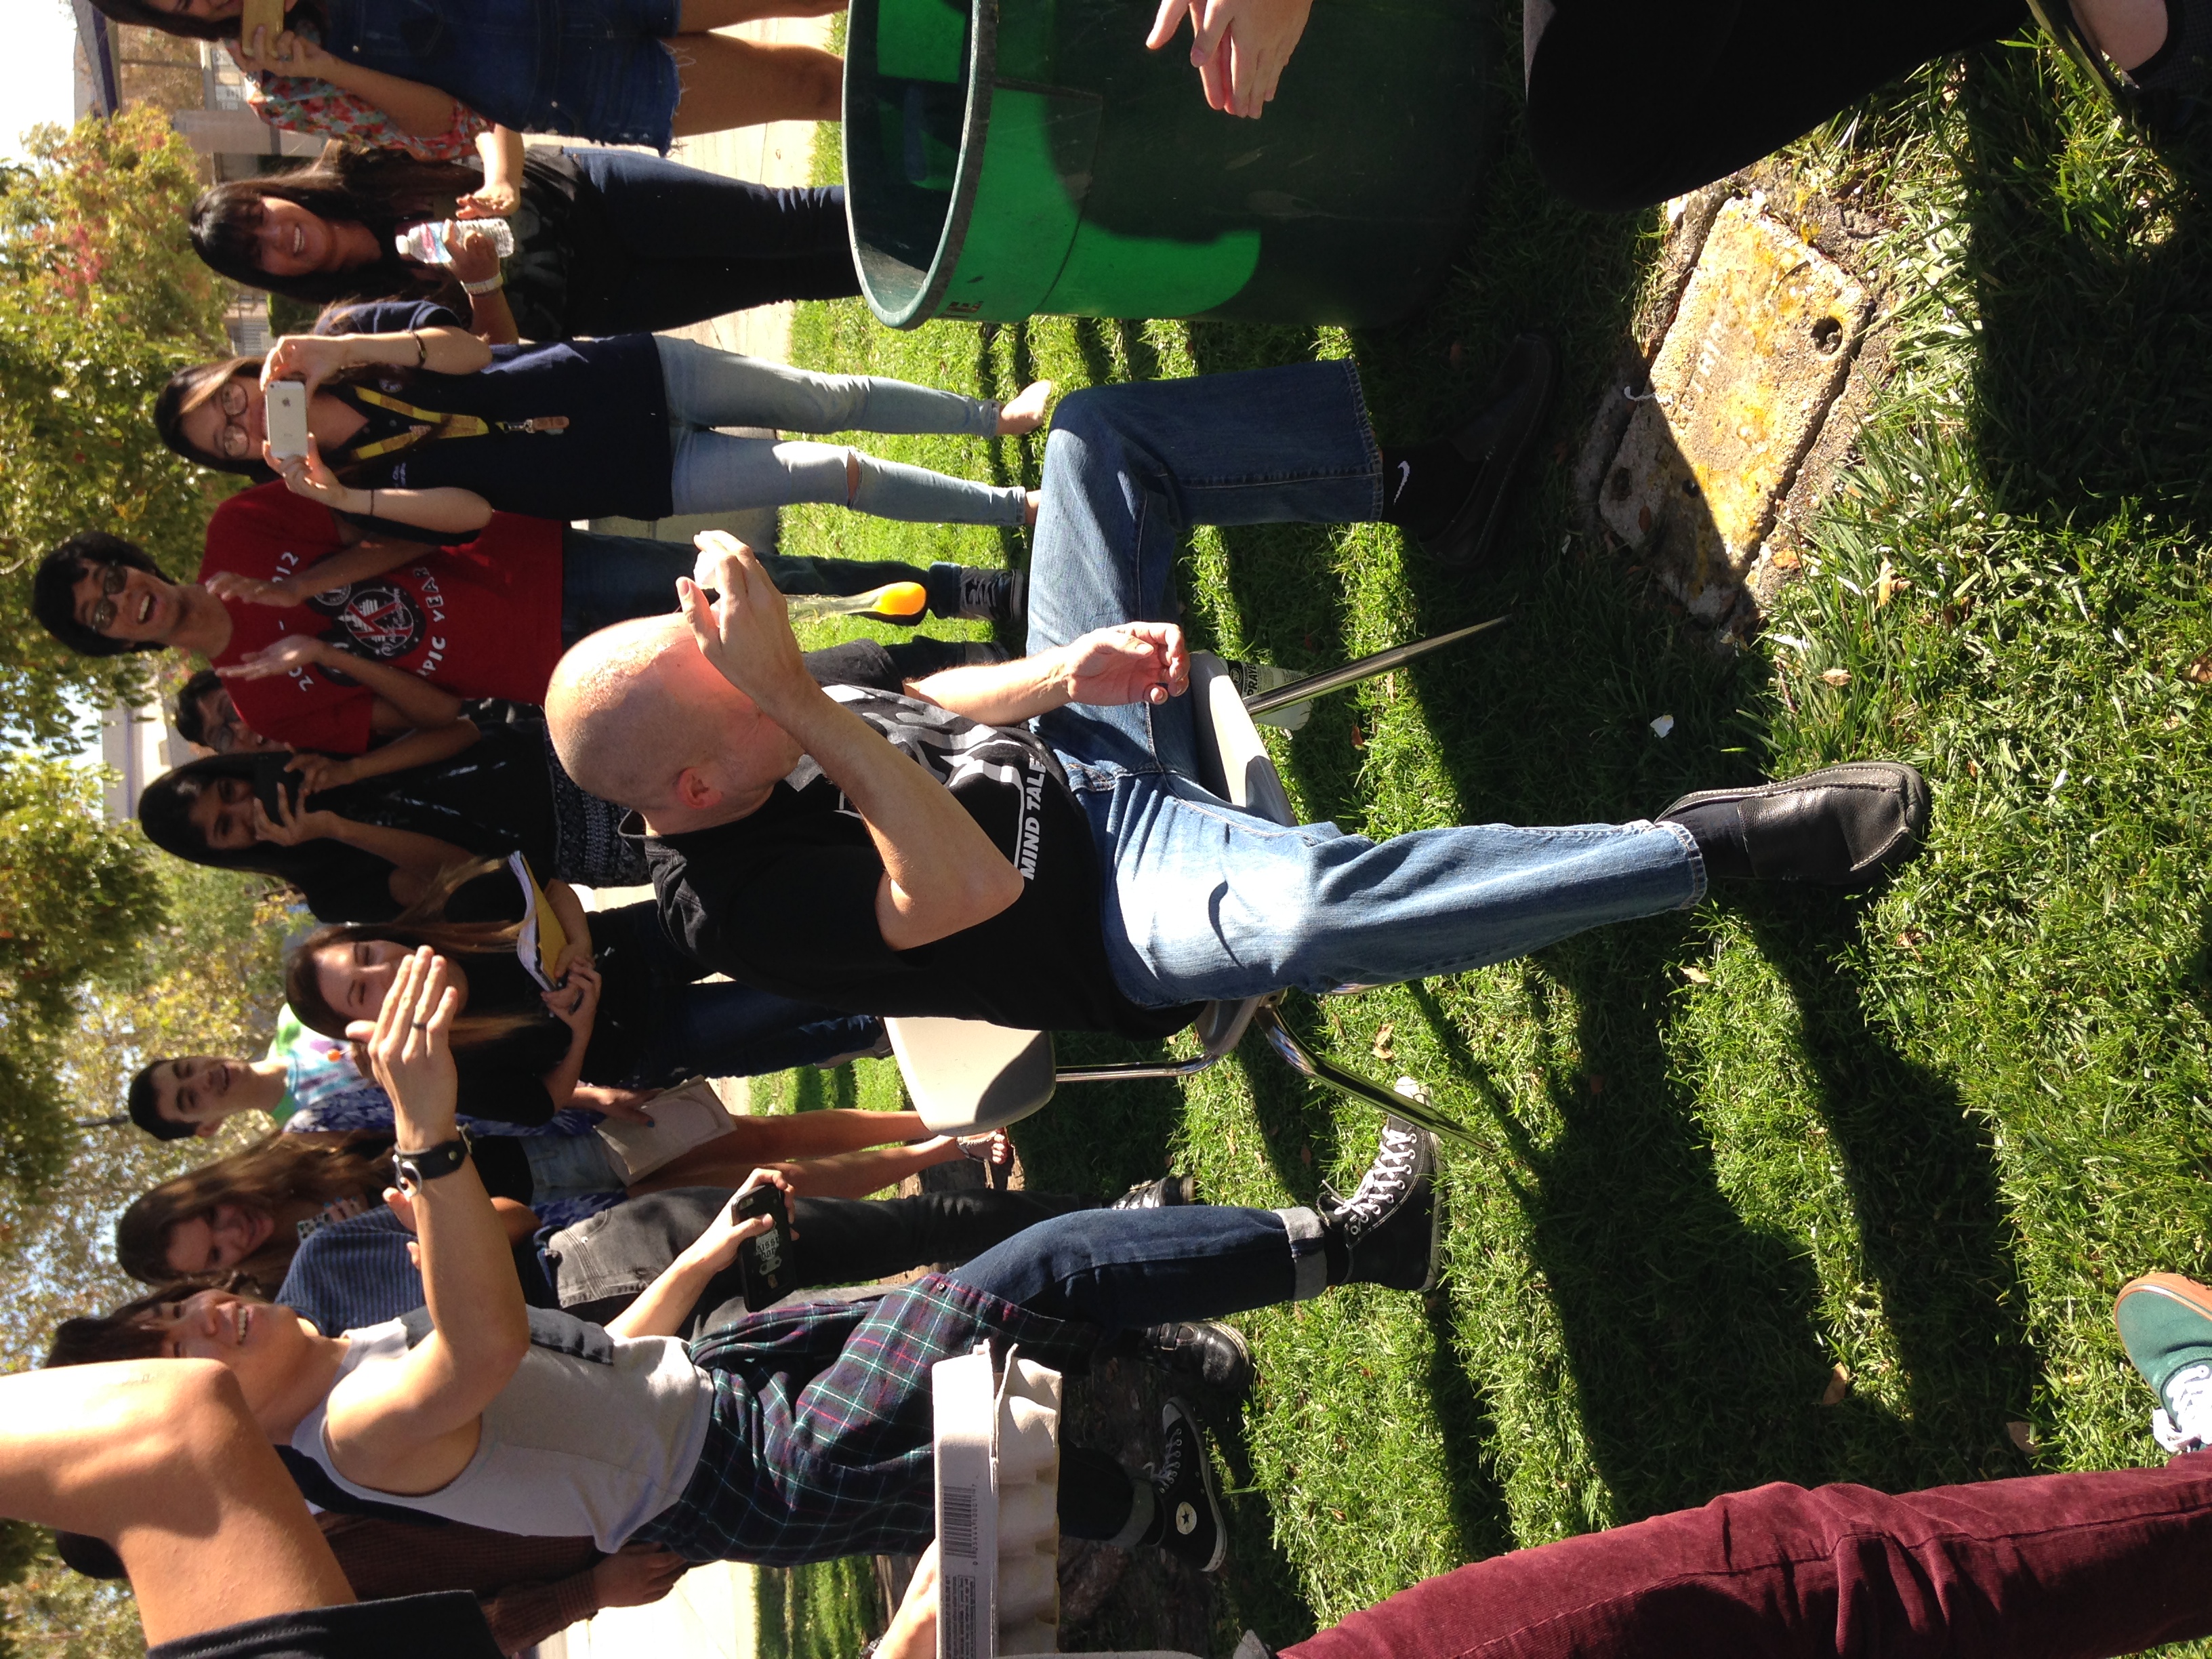
A crucial probability concept is independent vs. dependent events. A game played on the Jimmy Fallon show is a brilliant example of this concept. You can watch a sample here. My good friends James Bush and Paul Buckley first connected this Late Night fun with a statistics class.

James and Paul designed a version of this game with Easter Eggs and light-weight confetti inside. But I decided that I needed to go all the way. So I prepared real eggs (8 hard-boiled, 4 raw) and we trotted outside to play.

This messiness and fun seems worth it to me. The longer I teach, the more I am committed to giving my students mnemonic devices that really stick. After this lesson, when I want to remind my students about calculating dependent probabilities, one mention of an egg should do the trick. That seems well worth the effort. Besides, a little laughter is good for the soul!

Starting with design

This fall I decided to skip to chapter 11 in Stats, Modeling the World 4e and start my year with data collection. I made this choice for two reasons. Firstly, my AP Instructional Planning Report showed that my students couldn't describe a bias correctly. This was my lowest score. Secondly, I have a number of friends who swear that this is the best way to start the year. They testify that this topic starts the year at the right place conceptually and it requires the high level of clear communication that the course requires throughout.

[There is another advantage to starting with design. I'm getting the worst, most time-consuming grading of the year done in August. When I have the most energy. But that's a very selfish motivation.]

I started the year with lots of reading from SMW4e. I wanted kids to realize that their book is very readable and is a useful resource. We would read short passages in class and frequently consult the vocabulary sections at the end of each chapter. I can already see that this paying some dividends, as students have commented about how well the text is written. I have also seen students consulting the book in chapter two, with no prompting from me. They have realized that this is a useful and amazing resource.

I used the "Show Me the Money" activity from the latest CB module. If you haven't attended a CB workshop recently, I'm afraid that there is no way to share this resource at this time. It's a great activity where students try to guess the mean gross from the 2011 movie box office. Then students take a convenience sample (the movies they watched), a SRS and a stratified sample. The bias and the variability of these samples is discussed and contrasted. Doug Tyson did a great job writing this module.

I did a number of predictable practices: discussions, a quiz, a crossword, a small experiment (heart rate change drinking caffeinated soda vs. not [but this was on an insane minimum day and was more fun than learning]). I enjoyed using the Just Checking feature of SMW4e, as well as the practice exam with multiple choice items. 

My best new idea of the unit was this document. We took a group test (groups of 4, solving 4 problems together). Predictably, after the assessment (which is meant to be formative, but does count for a small grade), I was brain-storming how to help them write more clearly. I realized they needed a side-by-side comparison of what they said vs. what they should say. I'm still grading their first test, but it appears that for some students this document helped.

Students definitely had abnormally high anxiety about these introductory chapters. I don't know how much that is my fault. The wording of the rubrics is picky and communicating these complicated concepts is challenging. And my ability to adequately spiral these topics so that my jump-start can result in deeper learning remains to be determined. I guess I won't really know until I see the AP scores next July.


Power failure

George Box is famous stated “All models are wrong, but some models are useful.”

Educational researcher Robert Marzano recommends that a power curve be used to evaluate a student’s current level of understanding. This curve is supposed to be an effective model for assigning a student a score on a 4-point rubric while assessed over time. The curve is supposed to recognize and reward growth over time. You can see in this help document 4 nice examples of the power law behaving as Marzano promises.

However, in my experience, it turns out that the power law is a model for assessing student growth that has serious flaws. Fatal flaws. Here are the most egregious.

The biggest problem with the power law is that when a student has a “whoops” and bombs an assessment, I give them a score of 1. However, if a 1 occurs in the middle of the curve, the curve will not adjust upward and the student becomes frustrated.

3-3-1-3 = 1.90

3-3-1-3 = 1.90

3-3-1-3-4-4 = 3.07

I didn’t realize the problem until I had the same student come after class repeatedly to retake the same standard. My goal is that when a student does this, she is justly rewarded with a higher grade on that standard. However, she pointed out to me that because of the 1 she earned after the third assessment, her grade was not increasing. 

Other problems with the power law include:

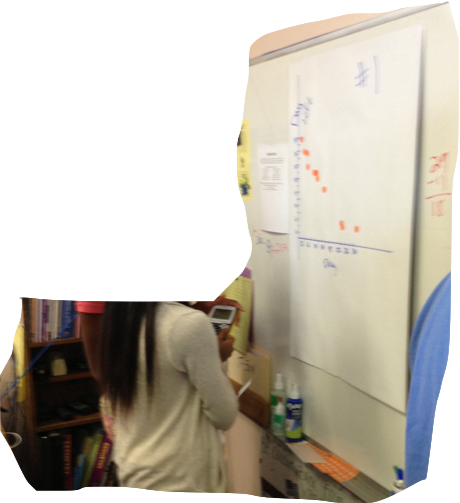
*Students and parents have no clue what how their grade is being calculated (it took me far too long to realize that I could use the indices 1, 2, 3, etc... paired with a student's scores and then use the power regression button on my calculator to predict a score. You will note on the second graphic that the Casio Prizm has an awesome feature of making predictions directly on the scatterplot.)

*You cannot assign a problem as worth less than 4 points. The power law will take this score to show a decrease in ability. Likewise, adjusting for difficult questions is unmanageable. 

*You cannot weight one assignment as more important than another.

*If you test the same standard several times at once, there is no way to enter the scores. The best you can do is average the scores together and then enter that score repeatedly.

*As some of my standards are not tested enough times for the power law to take effect, I have to use an average. But this only increases the cloudy confusion about how grades are determined. Some standards on the power law, some on an average.

I am not giving up on grading by standards. I think in Fall I will attempt a new version of SBG that uses weighted categories. Frankly, I am content with neither of the two options I've heard on twitter. Neither taking just the latest score, nor taking just the highest score seem satisfactory to me. More on this later.

2014 FRQ

1a) on campus: 24/33 = 72.73%

off campus: 37/67 = 55.22%

1b) Off campus students are much more likely to not participate in extra curriculuar activities than on campus students. Overall, it appears that on campus students are more likely to participate in 1 activity or 2 or more activities.

1c) With a large p-value of 23% > than any reasonable alpha, we fail to reject Ho. We failed to find evidence of an association between residential status and level of participation in extracurricular activities. 

[fascinating choice, writing team. The graph looks like there is an association and so do the summary stats. And then the inference procedure takes us the other way. I wonder how many students will think the 3 answers must align?]

2a) (3/9)(2/8)(1/7) = 1.2%

2b) As 3 women being picked would only happen 1.2% of the time by chance, it may be true that the manager did not use random selection.

2c) This is improper. The probability of picking a woman would stay at 1/3 the entire run of the simulation. But because we are sampling without replacement, the probability of picking a woman (or a man) changes with every selection.

3a) Normal; mu = 120, sigma = 10.5, P(x >140) = P(z > 1.905) = 2.8%

3b) The average of 3 days will have a smaller standard deviation (10.5/sqrt3) and should be closer to the average of 120. So the school would be less likely to lose funding.

3c) (2/5)^3 = 6.4%

[seems like a heavy probability year!]

4a) Because income is skewed right, the mean income will be greater than the median income. Thus reporting the mean will be a more impressive figure than reporting the median. The median would be the better choice because it would more accurately represent the true center of a skewed data set.

4b) Method 1 will suffer from a large voluntary response bias. Alumni with low income will not want to participate and thus the estimate will be too high.

Method 2 will be random thus less biased. While it will still suffer from a non-response bias, especially from those embarrassed by low-income, the estimate should be closer to the parameter. Still too low, but closer.

5) matched pairs t-test

Ho: mu = 0 (the true mean difference of woman - man = 0)

Ha: mu > 0 (''  "    "    "     "     "    "      "     "   >0)

men and women randomly selected; graph of differences reasonably symmetric

t = 3.118; df = 7

With a p-value of 0.008 < 0.05, I reject Ho. I found strong evidence that the difference in purchase price of women - men > 0.

6a) y-hat = 4.92 (plug in 175). 5.88 - 4.92 = 0.955 FCR. Car A had a fuel consumption rate that was 0.955 higher than predicted for its length of 175.

6bi) The point circled should be (93, 0.955).

6bii) Car B has a FCR that is almost exactly the same as its predicted FCR, given its length.

6c) For Engine Size, the larger the engine size, the larger the residual in using length. Whereas for the Wheel Base, there appears to be no association between the length of the wheel base and the size of the residual using length.

6d) He should use Engine Size, because it will add extra value to his model. It shows that Engine Size increasing also increasing FCR. Whereas Wheel Base adds no new information to the model.

[a #6 you can use BEBORE inference! Cool!].

Card Trick

To start inference I require two things:

1. "It's not unusual" by Tom Jones

2. My especially prepared deck of cards.

The theme song speaks for itself.

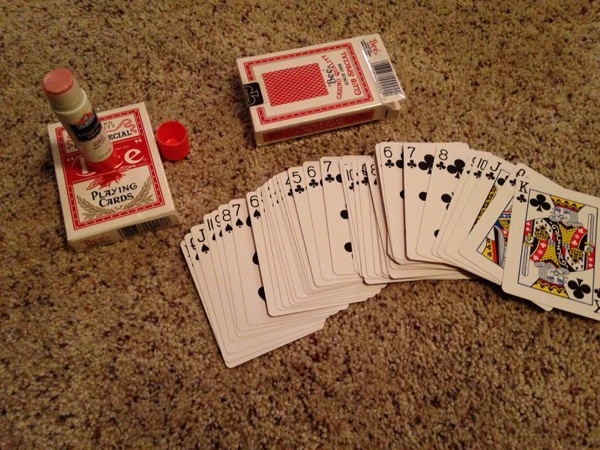
For the cards, I begin with a tale of my upcoming weekend adventures. This year I claimed that I was going to play some poker with my buddies while we watched the Super Bowl. As I'm describing my upcoming gambling exploits, I'm opening up a fresh, sealed deck of cards. 

Then comes the hook. I offer to let students draw two cards. If they're both red, they get a nice bit of extra credit (this year plus 2 on their rubric scores!). One red card is a smaller amount of extra credit, but two black cards will result in a small reduction in your grade.

As we've just finished a couple of very challenging assessments (CLT?!), I have plenty of eager students to take the risk. One by one, they draw two black cards. Upon each of these unfortunate incidents, I sadly add their hame to the board with a negative number next to their name.

By the fourth student, there is plenty of clamor to see the whole deck. I belatedly show them the deck--which is all black. I am called many names, I erase the victim's names from the board and pass out a bit of candy to ease their pain. 

Now we have an iron-clad example of a super low p-value! 8 black cards in a row is very unusual from a fair deck.

HT: Roxy Peck first showed me this activity. I've modified it slightly.

iphone-20140129165949-0.jpg

My prep work. A sharp utility knife opens up the bottom and you can slide out the cards and make an all black deck and an all red. Make sure you buy identical decks!

Buffet

What's better than Golden Coral or Home Town Buffet? Well. Actually, everything, ever. But that's beside the point. The correct answer is: An AP Statistics SBG'ing Test Buffet!

Today my students had 5 standards to choose from. They were required to take two tests. They could take 3 if time allowed. You can see in the picture below, every test is a different color and I made signs so students could pick easily. They picked one, completed it, then came up for a second, etc...

I'm in the middle of testing, so I might have more to report later. But here are a few observations.

  • Students knew which topic they had the lowest score on and grabbed that topic first.
  • Some of my students with high grades opted to take their one low standard and then they did a Normal Distribution problem because that is easy for them.
  • Testing this way seems to have alleviated some of the end of the semester whining about grades. Everyone knew that today they have a chance to prove me that they know their stuff. We'll see if that lasts into next week (the week before finals).
  • The number of students who are clueless about which standards to take is (thankfully) very small. As I said, everyone seemed to be very focused on their worst topic. Some students are a bit hesitant about picking a second.

Overall, this seems like a fantastic way to finish up the semester. Next week we'll take one last chapter test (random variables) and the final exam will be all multiple choice. If nothing else, this means I won't have to grade FRQ's over the Xmas break!

Next semester I want to try a test where half the test is the standard we just finished and the other half is a roll of a die to randomly determine an old, spiraled standard!

Standards Based Grading Buffet Test in AP Stats

For my AP Stats buddies, the 5 standards are:

  • Categorical data, independence and probability
  • Quantitative data
  • Regression
  • Normal Distribution
  • Surveys and Experiments

Correlation stations

This post made possible by Rachel at http://purpleprontopups.wordpress.com/ and Shelli at http://statteacher.blogspot.com. This post stems directly from their generous sharing.

I set out this fall to collect some data in an engaging activity. The parameters were:

  • Data that had a variety of directions and slopes.
  • 20 minutes of class time.
  • Data I could use throughout my AP Stats unit on regression
  • Edible

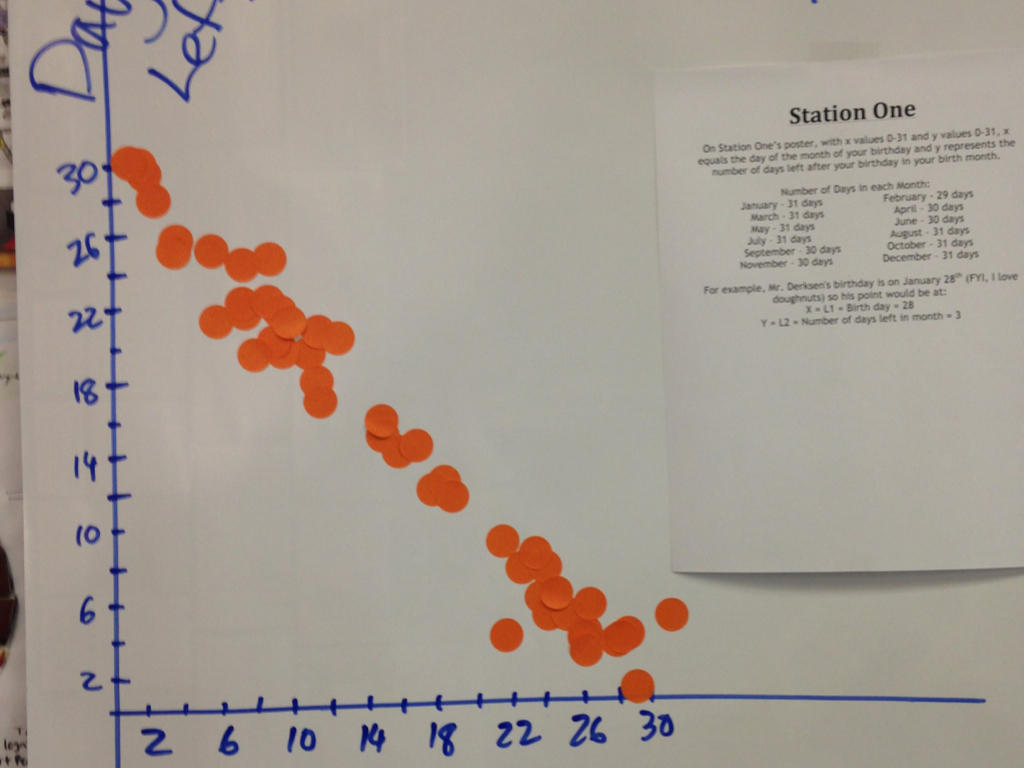
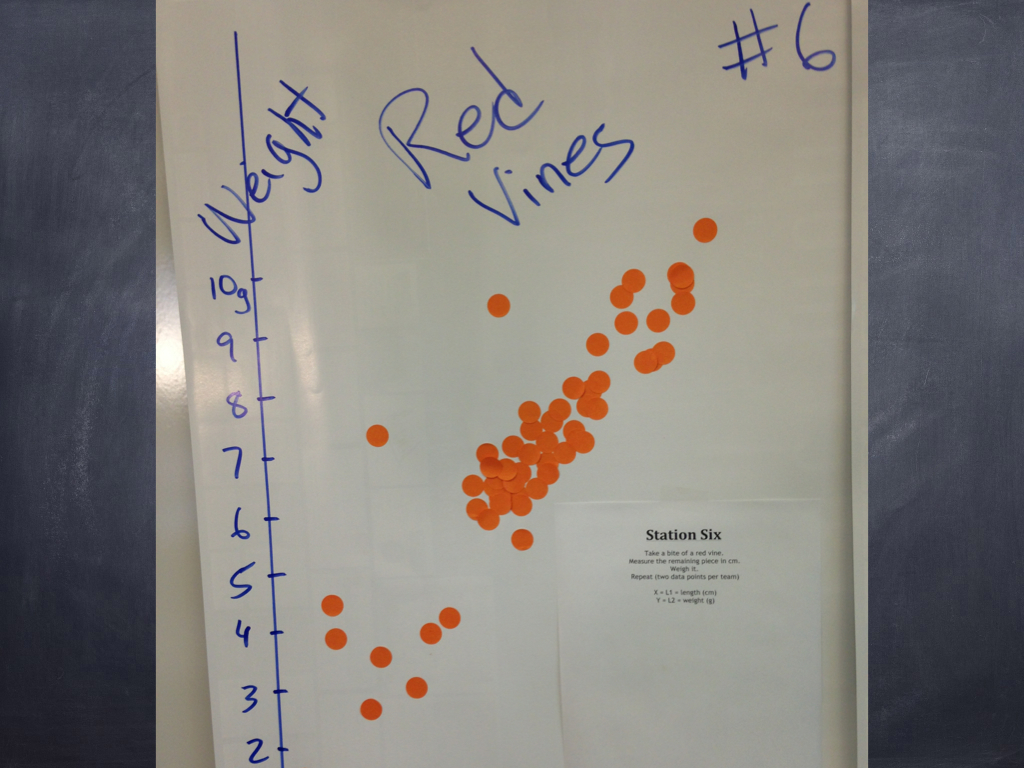
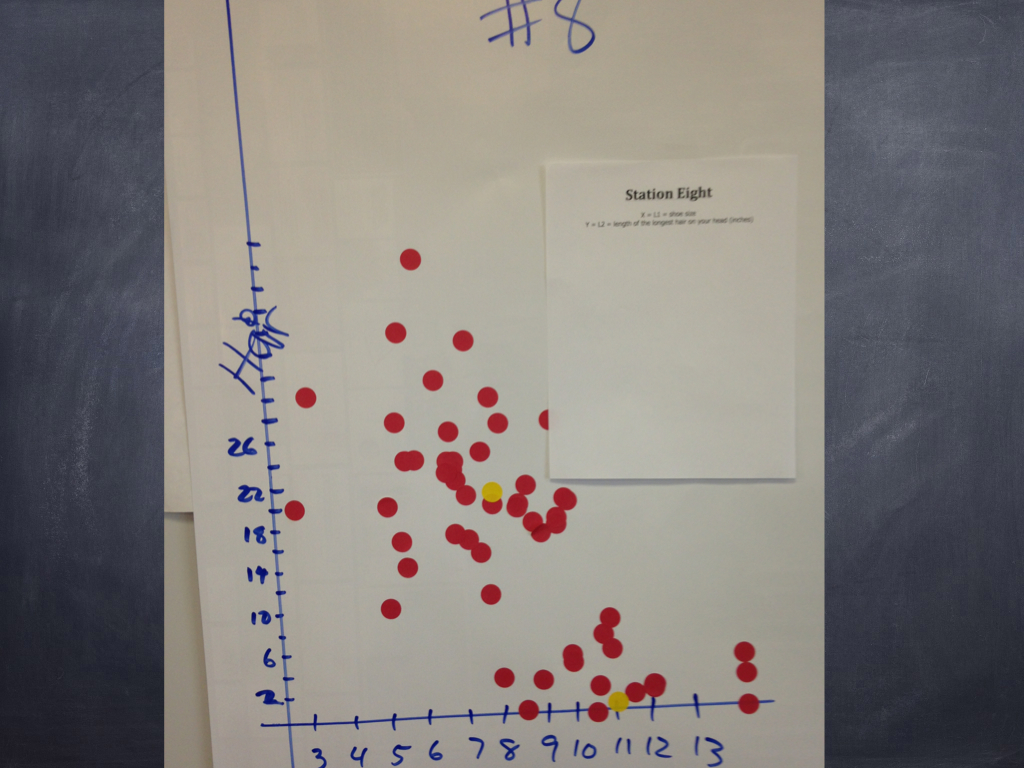
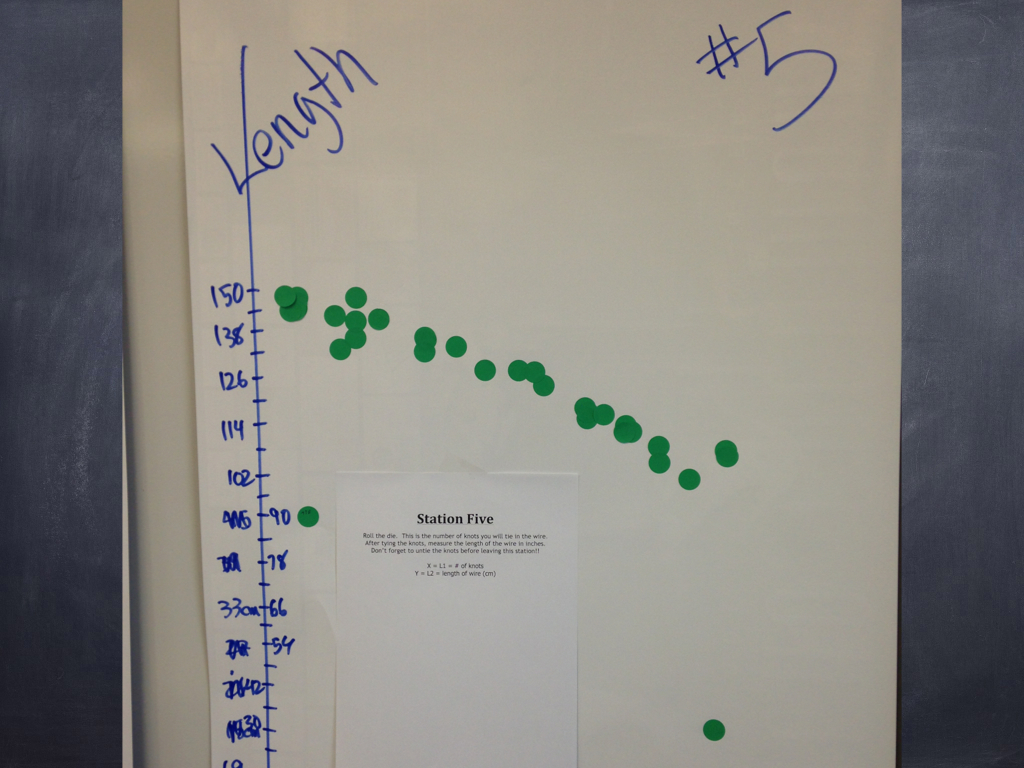
Thanks to aforementioned blogs, I got a huge start on my activity. You can read about all 8 stations I used in this document.

I ran the 8 stations for about 20 minutes at the beginning of each of my 3 AP stats classes. Note that these stations produced great 2-variable data. Anyone teaching lines of best fit could use these stations. This definitely includes the 8th and 9th grade CCSS on linear regression.

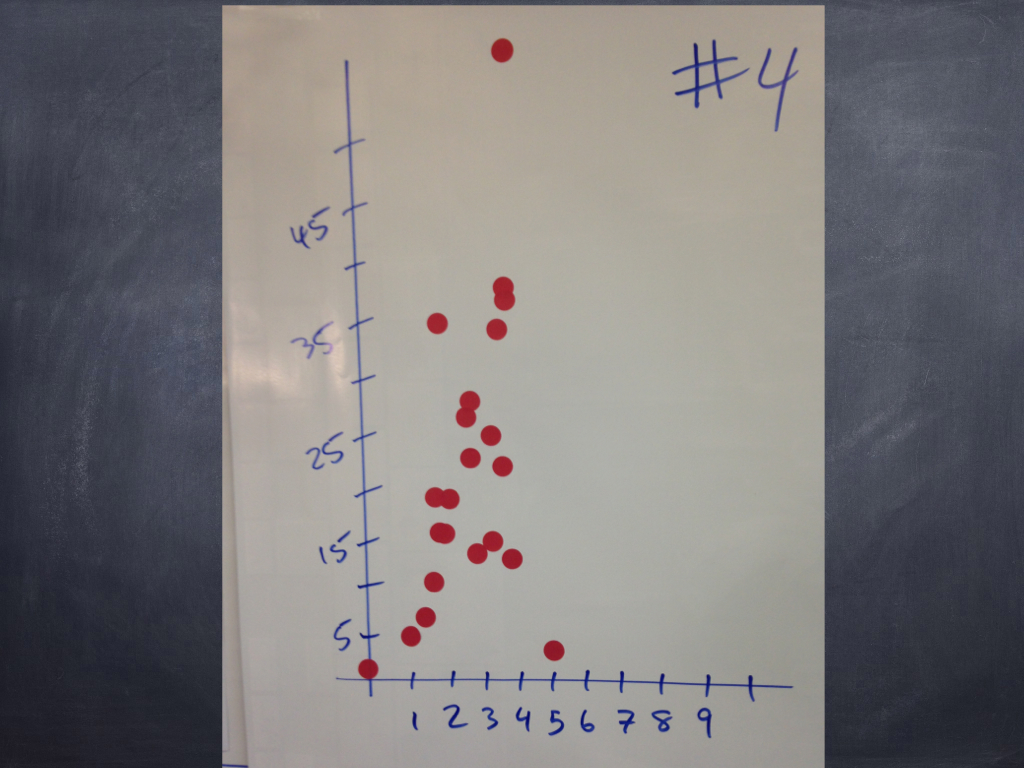
Students collected data and put physical dots on big graphs. After the activity, we looked at each graph and described them. This fit well into my standard first day of scatterplots--SOFA. Strength, outliers, form, and association. Students also typed their data into a graphing calculator that was at each station. I used this data throughout the unit to find the line of best of fit and to have students practice interpreting slope, y-intercept, correlation, etc...

A few notes about the stations to whet your appetite.

  • While you would think that length of name and length of hair would have no association, it did! There was a weak, negative trend. But students quickly realized that this was caused by gender grouping. Cool!
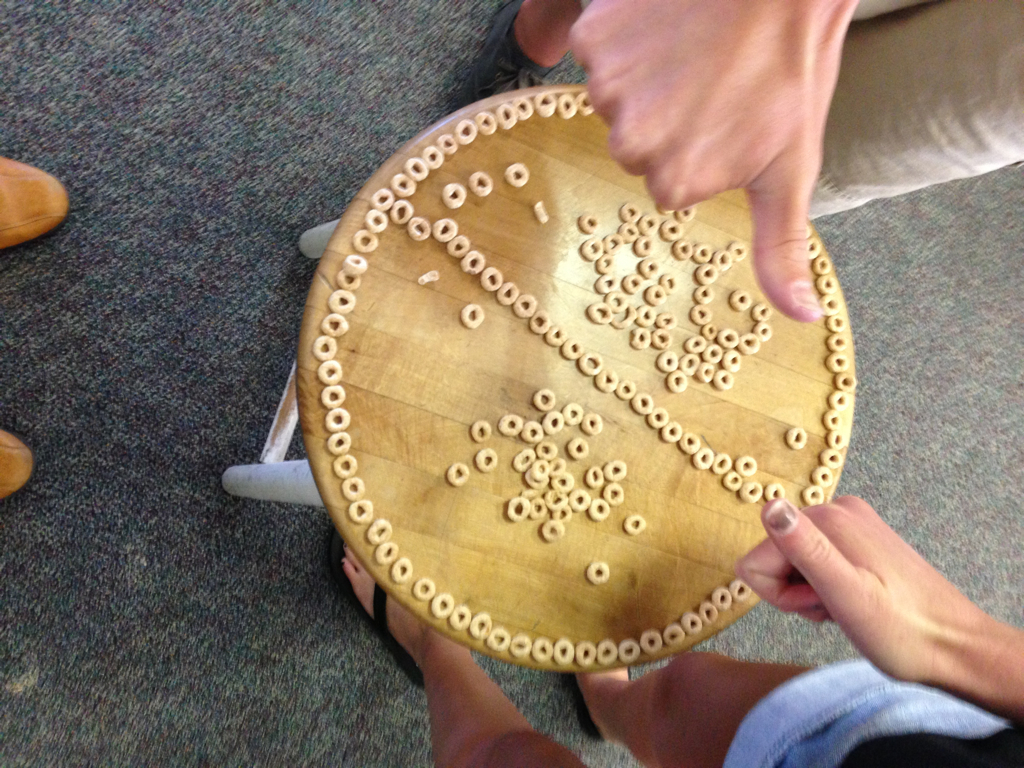
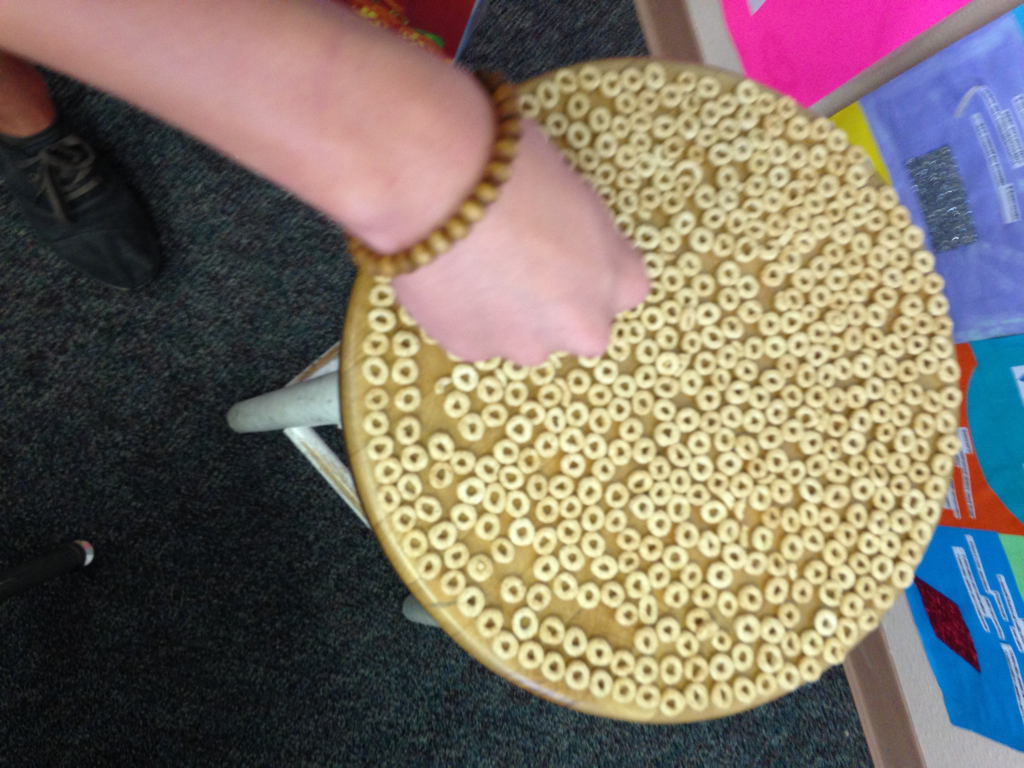
  • I had some students really have fun with cheerios. They made MASSIVE circles. One on my circular stool, then a second the width of the student tables. Since both of these circles were very close to a ratio of 3 and were much larger than the rest of the data [(26, 80) and (47, 149)], these points ended up VERY influential. When we removed them, the ratio of the diameter vs. circumference dropped to 2.3. With the influential points, the slope was a very satisfying 3.12. Fantastic example of influential points.
  • Students made typos. And measurement errors. I let the students see these errors. And we talked about fixing and/or deleting them.
  • I had non-influential outliers also. When students tied knots in the wire, some of them got goofy. But they were outliers in the y-direction and were not very influential.
  • I was not demanding enough on forearm measurement, and thus we were not very close to the Golden Ratio! :-( That station requires accuracy!

Overall, I couldn't have been more pleased. The data was real and interpreted smoothly. I lost NO time in my pace. I used the data over the course of several weeks and left the big graphs up for longer. 

Simple joys

Last week, I asked my Geometry students a very simple question. If any of them had any real memory for their Algebra 1 experience, it wouldn't have lasted 2 seconds. But they don't. They're a bunch of mediocre sophomores. Nice. Pleasant. I like them. But academically just not very impressive. 

I guided them to draw a line segment with a slope of 2/5 on graph paper. We drew something like this.

Screen Shot 2013-11-24 at 8.31.58 PM.png

Then I asked them to draw a line perpendicular to this line and figure out its slope. And because this class has memory skills that would make SpongeBob and Patrick look clever, I made sure we remembered what perpendicular meant. Then I set them to explore.

There is one simple key to this brief lesson that I like. I asked a question instead of providing a (magical) formula. 

As I circulated the room, students asked me if their answers were correct. Most weren't. But they kept trying. And this was my moment of joy. A glimmer of perseverance in problem solving (CCSS mathematical practice #1). Just a bit, mind you. But it was there. They knew I wasn't going to bail them out immediately. Most knew they'd have to try again. And they did. And in the process of their trial and error, I think they absorbed the right answer more deeply than if I had given it to them.

Dan Meyer has recently been discussing real world, fake math and relevance. I have no doubt that you could teach perpendicular slopes with a better (any!) context. However, my students were engaged. I posed a question. I asked them to hunt for a solution. They were curious, almost to a man. They tried and experimented and guessed. My geometry lessons need LOTS of help. But this simple lesson worked for me; my students were engaged.

More on coordinate geometry soon. 

The need for Chi

There was a cryptic comment on this handout for my 2013 exam walk through about the problems with running multiple tests. I had no time to elaborate, so I'll do so here.  

If you wanted to test if Froot Loops are uniformly distributed, one method you could use is to run a 1-proportion z-test (p = 20%) for each of the five colors. This has numerous problems. The biggest problem is the accumulation of Type 1 errors. Every time you run a test, you have (usually) a 5% chance of committing a Type 1 error. But now you ran five tests. So the sum results in a 25% chance of making a Type 1 error. 

The reason we need Chi-square is because it has the capacity to evaluate all five categories simultaneously and thus avoids this problem. Jessica Utts (the chief Reader in waiting) addressed this issue in her talk to the Readers. She discussed the problem of researchers running test after test after test until the find "significance". (This talk is posted on her page under Representative Presentations.)  You can also see a humorous presentation of this idea by the brilliant XCKD.

Further adventures in SBG

I'm over a month in. Here are a few thoughts about my further adventures in using Standards Based Grading in AP Stats. 

  • I've been grading my tests on rubric scoring for years. (AP Stats folks would recognize my EPI = 2, etc...) It is so awesome to NOT have to figure out how I want to convert 1-2-3-4 into 70-80-90. That is a time saver. I love it. 
  • I have to rewrite some of my assessments so that they are similar in length and difficulty. And I'm changing my file system. Now I need files that are organized by standard. With multiple assessments for each standard. Including enough assessments so that students can come after school and take even more.
  • I was initially worried about AP questions that are very difficult and will produce mostly 1's and 2's. I think I'm going to call these problems "plus one" problems. After they are all graded, I'll add one to everyone's score. Hopefully that will make the assessment. However, a question like this raises a concern regarding the power law. More on that later in the post.  And I what do I do with a 4 + 1 =5?
  • I discovered the hard way that my school website makes sub-standards under a larger standard more confusing, not less (Easy Grade Pro recommends using sub-standards to simplify student communication). So I had to ditch this plan altogether. No more sub-standards.
  • As I looked forward to my next "big" test (aka, a full period test), I began to fret. I couldn't figure out a way to get in all the new standards, old standards to retest and multiple choice into a one period test. Quizzes to the rescue! That next big test is over a week away. So I'm going to going to make sure and give two quizzes this week. They should take only 15 minutes each. I plan on reassessing one old standard and assessing a new standard for the first time.
  • Overall grades feel fine so far. I set the bar for 3.33 average for an A. That is feeling just right. Likewise with 2.75 for B's and 2.0 for C's.
  • My biggest mental dilemma right now is the power law. As I retest each assessment, a power curve will determine the student's current level of learning. My concern is that the free response questions vary in difficulty. So if I end with a fairly straightforward question, the power law will determine that the student level of understanding is high. If I choose a more challenging question, the scores will be lower. In theory, proficient (level 2) should be the same on every assessment. But in practice, that seems kind of tricky. And my textbook test bank has questions that add even more uncertainty. Part of me thinks that an average would be more fair, where you drop the lowest score to adjust for growth over time. But as soon as I type this, I see more flaws. For example, students can forget topics and not finish strong, but then drop that score. In short, I think I have yet to give enough assessments to see the full effect of the power law. I have tested the first topic twice. And when the power law has only two scores, the second score becomes their current score. Time will tell.

Formative assessment

I read Wiliam's Embedded Formative Assessment this summer.  (Thanks to my awesome principal, Dr. Kelsen, who buys me books if I say please!) I'm increasingly convinced that formative assessment is where its at, if you really want to improve student learning. In fact, my current belief is that if you start paying attention to student learning, you will end up on a path of formative assessment, retesting and eventually, Standards Based Grading. But I digress.

I'm not going to write much on this topic. You can read about these methods all sorts of places. I mostly wanted to share the document I made for my department. I challenged my department to take the 350 answer challenge. That is, I challenged them to listen to their students give 10 answers, per student, per week. Band teachers have all the luck. Every time their students play, they hear hundreds of "answers". Most of us have to work much harder to listen. 

I was quite impressed that some of my colleagues were willing to try the Red/Green classroom pace idea. They bought red and green solo cups. Every 2 students have a set of cups. If the lesson starts to get confusing, the students switch their green cups to red. Once there is too much red in the room, the teacher realizes its time to stop and see what the misunderstanding is about.  

Finally, a shout out to the crazy folk on Twitter who keep discussing this book all summer, especially on Wednesday nights for an hour. I couldn't always join, but you all are very motivating. 

Here the file. Let me know what questions you might have. 

AP Stats Standards

This year in my AP Stats classes I'm going to use Standards Based Grading. Nothing I've ever tried in my classroom has ever elicited so much curiosity, so I thought I'd try and blog about it. To begin this process, you have to chose a list of standards. My friend Drew who teaches Spanish and uses SBG tells me he changes his list every year. That relieved some pressure. It's not as if this the Perfect-List-of-Standards-for-All-Time.

The indented standards are sub-standards. Their scores will be averaged together to provide the overall standard grade for that topic. Most standards will not be graded on averages, however. They will graded using a power curve. This is the recommended function by the researcher Marzano. This curve is built into the program Easy Grade Pro, which I will be using. To see an example of how the power law works, take a look right here, towards the bottom of the page. I will grade projects and multiple choice tests on an average instead of a power law, but more on that later.

I will grade every item according to a 4 point rubric. As AP Stats already uses a 4 point rubric this works out rather well. (Note: I am departing from Marzano's system. He views a 4 as a score that is only given when a student goes above and beyond.) Every standard will be assessed multiple times. As the year progresses, the power law will determine the student's true ability on each standard. Then the standards are all averaged together (some with double weight. I can weight in EPG as I'd like. I'm sure I'll be changing that over the years) and an overall score from 0 to 4 is determined.

I've currently set 3.33 as the bottom of the A's, 2.75 for B and 2.0 for a C. I am very confident about the 2.0 standard for a C-. When students practice for the AP exam, I always tell them that they have to average 2's on the rubrics if they're going to pass. The actual score needed to pass the AP test is usually lower than this, but in my classroom, students who score 2's pass the AP test with a 3. 

There is so much more to say, but this blog post is already long. You can put questions in the comments, email, twitter, or wherever. I'll try to keep this going. 


AP Stats Standards for SBG

*I EDA Students can graph, analyze and describe data

     Cat (3) Students can graph and describe categorical variables

     *Quant (4/5) Students can graph, describe and compare quantitative variables.

*II LinReg Students can use and interpret linear regression models

III Design Students can apply and analyze methods for surveys, studies and experiments.

*IV Prob Students can calculate and explain probabilities, including random variables, normal calculations and the binomial model.

     P (14/15) Students will be able to solve probability problems

     RV (16) Students can use and interpret random variables

     N (6) Students can calculate normal probabilities

     B (17) Students can calculate and explain binomial probabilites

     SD (18) Students can calculate and describe sampling distributions

*V Prop Students can perform and interpret inference for proportions.

*VI Mean Students can perform and interpret inference for means.

VII Groups Students can use and interpret chi-square and slope inference.

Apply Students can apply, analyze and describe real world usage of statistics.

*MC Students can apply statistical concepts when asked in a multiple choice format.

*Double weighted standards


Don't call on me!

​I'm going to start reading Embedded Formative Assessment this summer. Some of my colleagues are already deep into the book and are inspiring me to continue. This post got me thinking about something I tried this year and like.

Equity sticks are popular. But they are not my favorite. The aforementioned blog post also expresses doubts about their use, as they don't always help discriminate who is called, regardless of how difficult the question is. Here's what I do instead. ​

I keep a jar ​of highlighters on my front desk by my seating chart. For extra ease of use, I have pens that click open with a push on the top--no caps to deal with. As I call on students, I use a yellow highlighter and put a slash across their name on my seating chart. Once everyone has a yellow slash, I switch to a different color and make the dash run the other way. This continues until my seating chart is filled with psychedelic asterisks. I can't always last all 5 colors before printing new charts, but it is surprisingly easy to spy which students have yet to be called on.

The big advantage to this system is that I can more carefully choose when I call on each student, while still ensuring that every student participates. If I have a student who aces everything, I can throw them my most challenging question. I often have students work with their partners and/or groups before I call on them. Then I will call on weaker students, who just a chance to gather their thoughts and get some help before they participate.

Multiple methods

Glenn Beck is criticizing the new Common Core standards. I have some interest in politics. But this is not about that. I have 25 years of my life invested into math education. So far what I have seen of Beck's criticism is wildly off base. Here is one correction. There may be more to follow.​

Beck states that addition with regrouping is a new-new-math that is dangerous and that dumbs down our children. I'll explain what regrouping is and why it is actually awesome.​

I'll use Beck's example: 29 + 17. How would you do this problem? (Without a calculator)​

Most of you would want to grab pencil and paper and commence the adding algorithm. This involves "carrying a 1", takes a few seconds and is reasonably accurate.​

However, do you know why you "carried a 1"? Do you realize that 9 + 7 = 16 and that 10 of the 16 can be transformed into a 6 in units column and a 1 in the tens column?​

Regrouping emphasizes student understanding of why "carrying the 1" makes sense.​

Most math folk don't do mental math from right to left. It doesn't work very well or is as quick as regrouping. If I did this problem I would think ​

20 + 10 is 30

9 + 7 = 16

30 and 16 make 46.​

Beck ridicules this very method. When you write it on paper, it looks longer. In your mind, it is remarkably nimble. You might not trust my mental tricks. But perhaps you would trust Arthur Benjamin's. ​I've heard Dr. Benjamin talk about mental arithmetic. Like most mental arithmetic experts, one of the first things he will do is explain to you that you don't work mentally like you do on paper. And that you often work with regroupings and from left to right.

But its not just mental arithmetic that motivates regrouping. It is an understanding of place value.​ Let me move to a second example. How do you multiply 33 x 21? If you follow the typical American procedure, you will multiply by 1 x 33 and write down 33. Then you write a zero in the next row. STOP! 

Why? ​Why a zero to start row two? Because you're not about to multiply by 2. You're about to multiply by 20. That's right, TWENTY. (I have a friend who is a heart surgeon. When I explained this to him he said he never understood why the zero is there. And he's a smart guy. But he had never been taught this fundamental fact with any understanding!)

So if we regroup, we get something like this:​

33 x 21 = (33 x 20) + (33 x 1)​

And 660 + 33 is pretty easy to do in your head. It's 693. ​

Mr Beck might complain that this is longer (and he's sure to write it on his nifty chalk board as if it is much worse. I wonder if he knows that white-boards have been invented?) but if he paused for a second, he might realize that it's looking kind of familiar.  It's looking like the distributive property! The same property that's so handy in Algebra 1! And pretty much the rest of advanced math. In fact, a strong multiplication unit (in the common core) will distribute the problem out all the way:​

33 x 21 = (30 + 3) x (20 + 1) = 30x20 + 30x1 + 3x20 + 3x1 = ...​

You might recognize this as FOIL'ing (I'll have to correct the atrocity of that mnemonic on another post) and rest of the world introduces the distributive property in this manner pretty early on.​ It builds algebraic thinking from a young age.

More to follow. Comments welcome.​

Late work

Every fall I get a list that tells me which of my students have medical conditions. It is clearly useful for me to know if I have students whose blood sugar may drop due to diabetes, may be prone to seizures, etc...  There is usually one student on my list, however that may surprise you. I invariably have one student listed who has urinary tract infections. My instructions printed on the sheet are to let her use the restroom whenever she requests. 

If this sounds odd to you, I'm right with you. Why wouldn't a reasonable person let a student use the restroom when they need to? If you think that a request like this is only created because some parents out there are crazy, you can just stop reading this post right now. I'm only going annoy you.

School culture is a strange thing, that's what I've been mulling over recently.  The four oddities that strike me are:

  • Going to the bathroom 
  • Turning in late work
  • Cell phone use
  • Tardies

As a general observation, I would say that many teachers spend a lot of time and energy around this issues while students feel that their teachers care more about these things than they do about anything else (including learning).

In fairness to teachers, managing students can drive you nuts.  Its a crazy task with too many bodies, too many pieces of paper and endless interruptions. And all of the things on the list above can create distractions from our primary goal: Learning.  However, you don't have to think too long before you realize that we're kind of nutty about these issues.  A few examples:

  • On my campus, teachers regularly come late to school.  Some of them are the same teachers that never tolerate tardies with their students and will drop them from the class after their fifth tardy.
  • At our staff meetings you can see teachers checking their phones constantly. I see this behavior everywhere I go. Schools are the only place I can think of with zero tolerance for phones.
  • The IRS, the DMV and the credit card companies accept late payments, usually for a 10%penalty.  Yet at two back-to-school nights this fall, at least half of my own children's teachers made it clear that late would not be accepted, Ever.

Let me be clear.  I want to teach students responsibility.  I want them to learn when and how is the appropriate time to use their phones. I like it when my co-workers are punctual in their duties. But consider this anecdote.

One Thursday our campus had a football game.  As I looked across my 5th period stats class, I noticed that I had several football players, a few cheerleaders and several band kids. These kids would pretty much be busy from 2pm to 11pm.  So at the end of class, I announced that the homework I was assigning that night could be a day late for all involved. To me this seemed reasonable. My students responded like I had given them a huge present. This surprised me. Was it so unusual for these great students to be given one night's grace on their work? I teach on a campus with GREAT faculty. They amaze me. Yet apparently this was an unusual offer.

In the end, I think this post is a plea. A request for reasonableness. I think as teachers we can surmount the challenge of dealing with the craziness of these headaches by embracing two concepts: compassion and creativity.

Compassion guides us as we realize that our students are kids. They are growing and learning and all too often not in control of all the variables in their life.  I have student with an iPhone. Her dad has yet to buy her a scientific calculator this year. So every day she borrows one of my mine. So be it.  I had a student fail to bring in his big polygon project. He tells me he was kicked out of dad's house in the afternoon and had to go to his mom's instead.  Where he had no supplies. So I took the project the next day and took off just a few points. Who knows if it was his fault or his parents or some mixture in-between? But I'm thrilled that he let me know what was going on. He was failing my class initially, but went to some of our extra Saturday study sessions and has rasied his grade to a C.

Creativity helps us get what we want out of students, and separate those who deserve mercy from those who don't. A 10 minute delay in granting a bathroom pass can help discern a biological need from a leisurely stroll across campus. I often use writing lines as a silly punishment for silly behavior. Writing "My future employer will appreciate my punctuality" 25 times usually convinces the tardy student that one last kiss just wasn't worth it. And his classmates usually notice (especially if the lines are taped to the window during the last week of the year when tardies grow with spring flowers) and join in the race up the stairs.

In the end I think a zero-tolerance policy or a rule that is 100% "consistent" (read: inflexible) is more comforting to many teachers. But it rarely actually results in justice. Our students are children. And humans. They deserve thoughtful and compassionate classroom policies that have the flexibility needed to bend with their growth and to maximize learning.